|
Package
|
Mesh (all TriComp packages)
|
|
Input files
|
function01.pl, function01.min,function02.pl,function02.min,function03.pl,function03.min
function03.png
Download Mesh_Data_Images.zip
|
|
Description
|
An advanced feature of Mesh (the conformal triangular mesh generator for all 2D TriComp programs) is the ability to generate meshes incorporating information from tables of numerical values (data images). The process is described in Chap. 8 of the Mesh manual. A data table could contain values that describe variations of quantities like electrical conductivity, temperature or current density over a region of the x-y plane. The data may be discontinuous or generated from continuous mathematical functions. In the latter case, fitting routines can be applied to create a conformal mesh that closely follows function contours. Three examples demonstrate the capability. Each example includes a Perl script to write the data table and a Mesh input file to generate the mesh.
|
|
Results
|
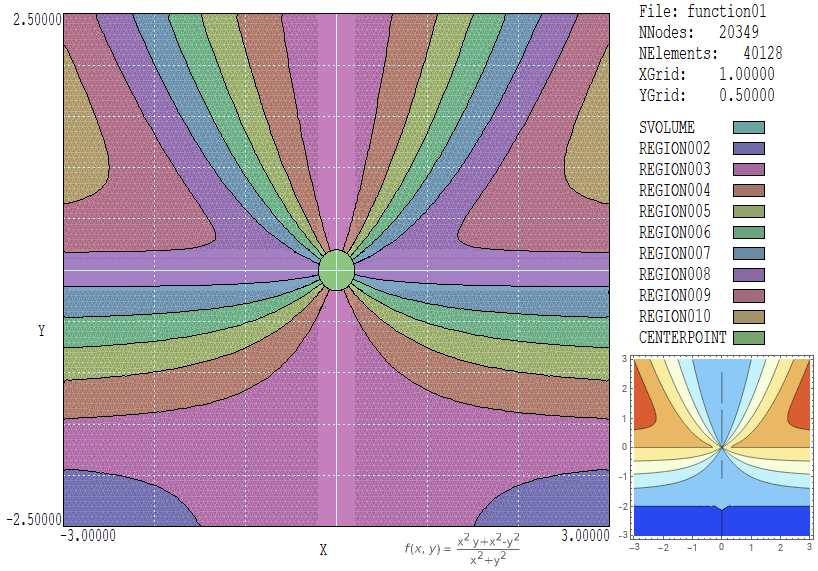
In the top illustration (Function01), a table defined in a square region (6x6) is mapped into a (5x6) rectangle. The Mesh script contains the following section:
IMAGE
  DataFile Function01.DAT FIT
  Intervals
    -1.6 -1.2
    -1.2 -0.8
    -0.8 -0.4
    -0.4  0.0
     0.0  0.4
     0.4  0.8
     0.8  1.2
     1.2  1.6
     1.6  2.0
  End
  Correct 10
END
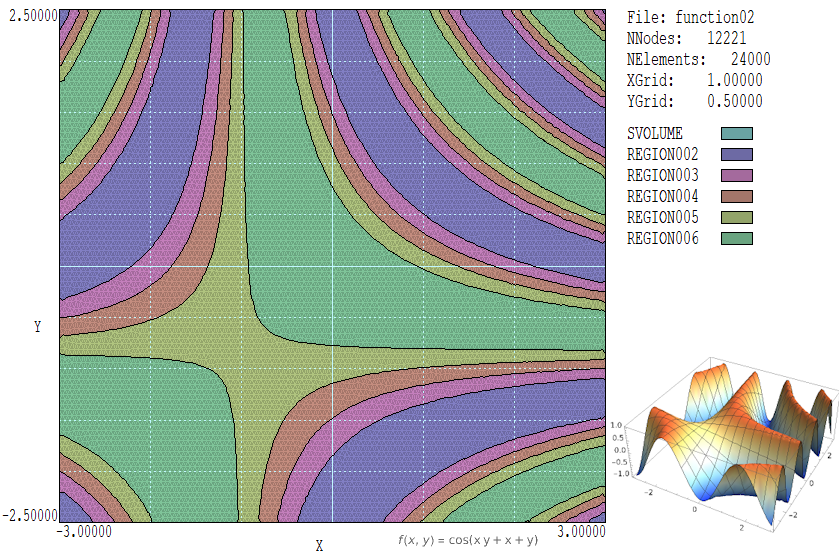
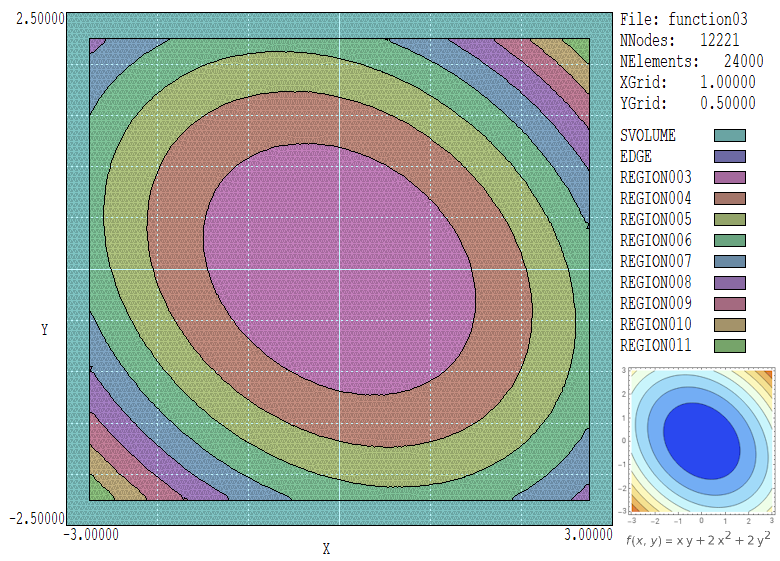
To assign the intervals, a useful technique is to make a dummy run with a single interval and then to check the analysis of limits in the Mesh listing file (MLS). The function presents a challenge because it is diverges numerically at the origin where several contour lines converge. Although the mesh has fine resolution near this point, the fitting process is sporadic when the contour spacing is less than the element size. We have added a circular electrode definition after the Image section to show how a practical solution might procedure. The second illustration (Function02) demonstrates that the method is able to model complex variations. The final example (Function03) show how to map the data image to a section of the mesh area with sharp boundaries.
|
|
Comments
|
The test functions and inset plots were adapted from the Wolfram Demonstration Project
Graph and Contour Plots of Functions of Two Variables.
|