|
Input files
|
bbar.min, bbar.nin, bbar.scr,bbar.bat
Download ConductorLoss.zip
|
|
Description
|
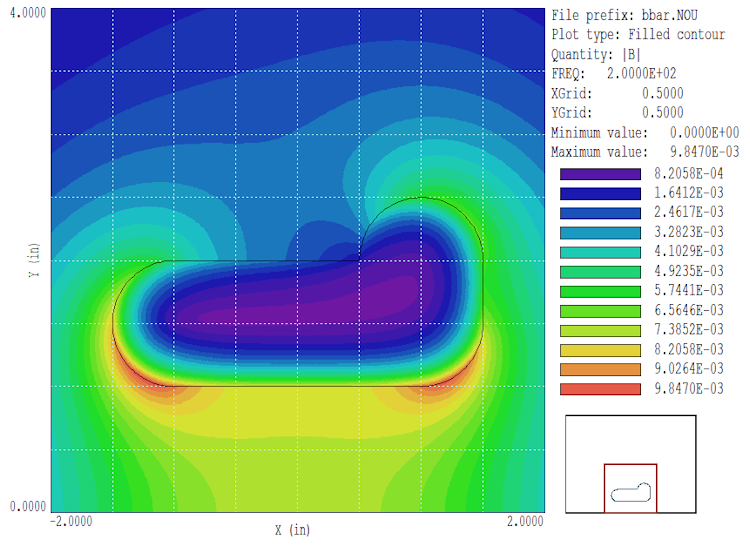
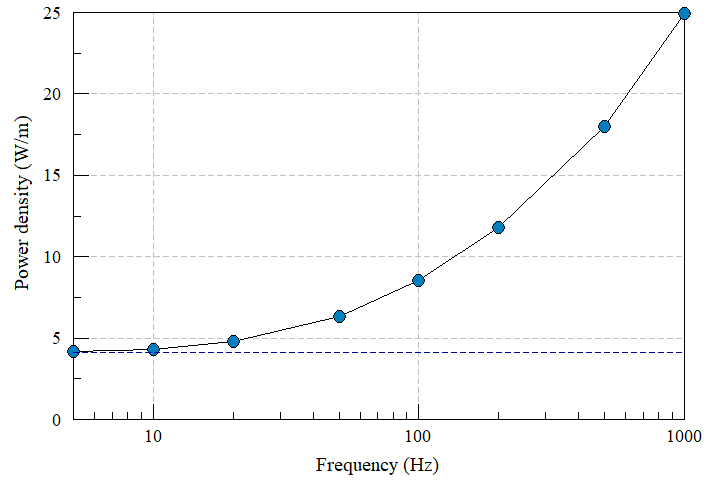
As the frequency increases, skin depth effects cause an increase in the resistance per length of conductors and bus bars by reducing the effective cross sectional area. Analytic estimates are possible for simple geometries like coaxial cylinders, but numerical methods are essential for complex conductor shapes or asymmetric systems. This example shows how to model linear resistance and power loss in bus bars with complex shapes using the Nelson code. The top picture shows the distribution of magnetic flux density around the top bar of a symmetric conductor pair at 200 Hz. The example illustrates the use of background calculations controlled by a batch file to generate the values of graph (lower picture).
|
|
Results
|
The graph shows the calculated power loss per length in the top bar for a drive current of amplitude Io = 1000.0 A. The DC value can be determined analytically. The resistance per length is given by R = 1/(Sigma*Ac). Nelson reports a bar cross section area of Ac = 2.085E-03 m^2 and the conductance of the copper bar is Sigma = 5.814E7. Substituting values gives the resistance as R = 8.250E-6 ohm/m. The DC power per length is I^2*R/2 = 4.125 W/m (the dashed line in the graph).
|
|
Comments
|
If the system is not symmetric about y = 0.0 (e.g., busbar above a plate), the lower electrode must be included and assigned a current 180 degrees out of phase with the top electrode. |